

A national home decor retailer with locations across the United States and Canada came to Propellant Media through our inbound lead system. The company already ran a mature marketing program built on paid search, social advertising, and local television. It had also attempted programmatic advertising twice before with other partners, and neither attempt produced a result the company could point to.
The engagement described here is a pilot: six store locations in a single Northeast market, with a path to additional locations nationally if the model proves out.
The Challenge
The retailer wanted geofencing. Its stores sit in dense suburban retail corridors with competitors nearby, and location targeting is an intuitive fit for a business that needs people to physically walk through a door and sit down with a designer.
The difficulty with geofencing as a standalone buy is that it is a prospecting tactic. It builds an audience of people who were recently near a store, a competitor, or a relevant point of interest. What it does not do on its own is give that audience a second and third opportunity to act. An audience gets built and then has nowhere to land. That is the most likely explanation for why two earlier programmatic efforts produced nothing measurable.
Our recommendation was not the tactic the client asked for. It was a chain: online and offline targeting feeding a return layer, so that the audience prospecting created had somewhere to go.
What Our Team Was Tasked With
Round out a mature digital program with the one channel the client had never made work, and produce measurable activity at six specific store locations. The tracked outcome was design center appointment requests and inquiries, captured by conversion pixel, with in-store visit measurement to be added as the pilot matures.
Media Plan We Developed
- Geofencing: Location targeting built around each store’s trade area and the surrounding retail corridors, serving to devices observed in those polygons.
- Audience data segments: Third-party behavioral and in-market segments for home improvement, interior design, and recent movers, run against each store’s geography.
- Site retargeting: The return layer. Every visitor produced by the two prospecting tactics, plus organic and paid traffic from the client’s other channels, re-served across the open exchange.
- Programmatic video (OLV): Three cuts at :15 and :30 carrying the seasonal promotional message and the brand story.
- Static display: Five standard sizes running promotional and evergreen creative in parallel.
Every one of the six stores ran all three targeting tactics in both creative formats. That produced 36 individual line items rather than a single regional buy, which meant each location carried its own budget and could be read on its own rather than disappearing into a market average.
Creative And Format Alignment
Two creative families ran simultaneously: a seasonal promotional set built around a dated offer, and an evergreen brand set. Both were produced in five static sizes and three video cuts so that no targeting tactic was starved of format options and so creative performance could be separated from targeting performance in reporting.
Campaign Results
The figures below cover the first three weeks of delivery, August 7 to August 28, 2026.
| Tactic | Impressions | Clicks | CTR | Conversions |
|---|---|---|---|---|
| Site retargeting | 36,673 | 46 | 0.125% | 19 |
| Audience data segments | 312,774 | 283 | 0.090% | 11 |
| Geofencing | 213,151 | 138 | 0.065% | 1 |
| Total | 562,598 | 467 | 0.083% | 31 |
What The Data Settled
Three weeks is a short window, and we treat it as directional rather than conclusive. But two independent signals in this data point the same direction, which is worth naming.
The first is where the conversions concentrated. Site retargeting carried 6.5% of total impressions and produced 61% of all conversions.
| Site retargeting | 61.3% | |
| Audience data segments | 35.5% | |
| Geofencing | 3.2% |
The second is click-through rate measured against our own programmatic display benchmark of 0.10%. Blended across all three tactics, this campaign ran at 0.083%, below that benchmark. Site retargeting was the only tactic to clear it, at 0.125%.
| Site retargeting | 0.125% | |
| Benchmark | 0.100% | |
| Audience data segments | 0.090% | |
| Geofencing | 0.065% |
The wrong conclusion to draw from those two charts is that prospecting failed and the budget should move to retargeting. Site retargeting has no audience to convert without the tactics that build it. What the data actually validates is the chain: geofencing and audience segments create the pool, and the return layer closes it. Read that way, the concentration in retargeting is evidence the structure works, not evidence that two thirds of the plan is waste.
Creative format told a similar story. Static display took a minority of delivery at 210,081 impressions and produced 13 conversions, while video delivered 352,517 impressions and produced 18. Static was the more efficient format per impression in this window, which is now a live question for how the next flight is weighted.
What We Take To The Next Campaign
- Never sell location targeting as a standalone tactic. Geofencing fills the top of a funnel. Without a retargeting layer beneath it, the audience it builds has nowhere to land, and the client sees a delivery report instead of a result.
- Structure multi-location pilots by location from day one. Six stores running as 36 separate line items cost more to build and maintain than a single regional buy, and it is the only reason store-level performance is legible at three weeks instead of six months.
- Agree the value of a customer before the contract is signed. When both sides know what an appointment is worth, early conversion volume becomes a conversation about pacing rather than a debate about whether the channel works.
- Instrument in-store visit measurement alongside launch. For a retail pilot, foot traffic is the outcome the business actually cares about, and it should be measurable from the first week of delivery.
Where This Stands
The pilot is ongoing. In its first three weeks it delivered 562,598 impressions across six store geographies and produced 31 design center appointment requests and inquiries for a retailer that had twice tried programmatic and gotten nothing it could measure. The structural question the client brought us — why does this channel not work for us — now has an answer supported by its own data, and the next phase adds in-store visit measurement to complete the picture.
Frequently Asked Questions
Why did geofencing alone not work for this retailer previously?
Because geofencing is a prospecting tactic, not a closing one. It builds an audience of people observed near a store or competitor, but on its own it gives that audience no second or third opportunity to act. In this pilot, geofencing delivered 213,151 impressions and produced one tracked conversion, while the site retargeting layer built on top of that traffic produced 19 from just 36,673 impressions. The tactic is not the problem; running it without a return layer is.
Is a 0.083% click-through rate good for programmatic display?
No. Our programmatic display benchmark is 0.10%, and the blended figure across all three tactics in this window came in below it. We publish that rather than reporting only the tactic that cleared the bar. The more useful read is that CTR and conversion concentration agreed with each other: site retargeting was both the only tactic above benchmark at 0.125% and the source of 61% of conversions, which is a stronger signal than either number alone.
How many conversions should a multi-location retail pilot expect early on?
This pilot produced 31 tracked conversions across six stores in three weeks of delivery. Early volume matters less than whether the structure is legible: because each store ran its own line items, delivery was near even across all six while conversions ranged from two to seven per location. That spread is what gets optimized in month two. A pilot that blends six stores into one regional buy cannot surface it at all.
Why measure appointment requests instead of in-store visits for a retail campaign?
In-store visit measurement is the right primary metric for a six-store retail pilot, and it is being added to this engagement. During the window covered here it was not yet instrumented, so every conversion reported is a design center appointment request or inquiry captured by conversion pixel. We report what was measured rather than estimating foot traffic that was not, and we treat the timing of that instrumentation as a lesson for the next retail launch.

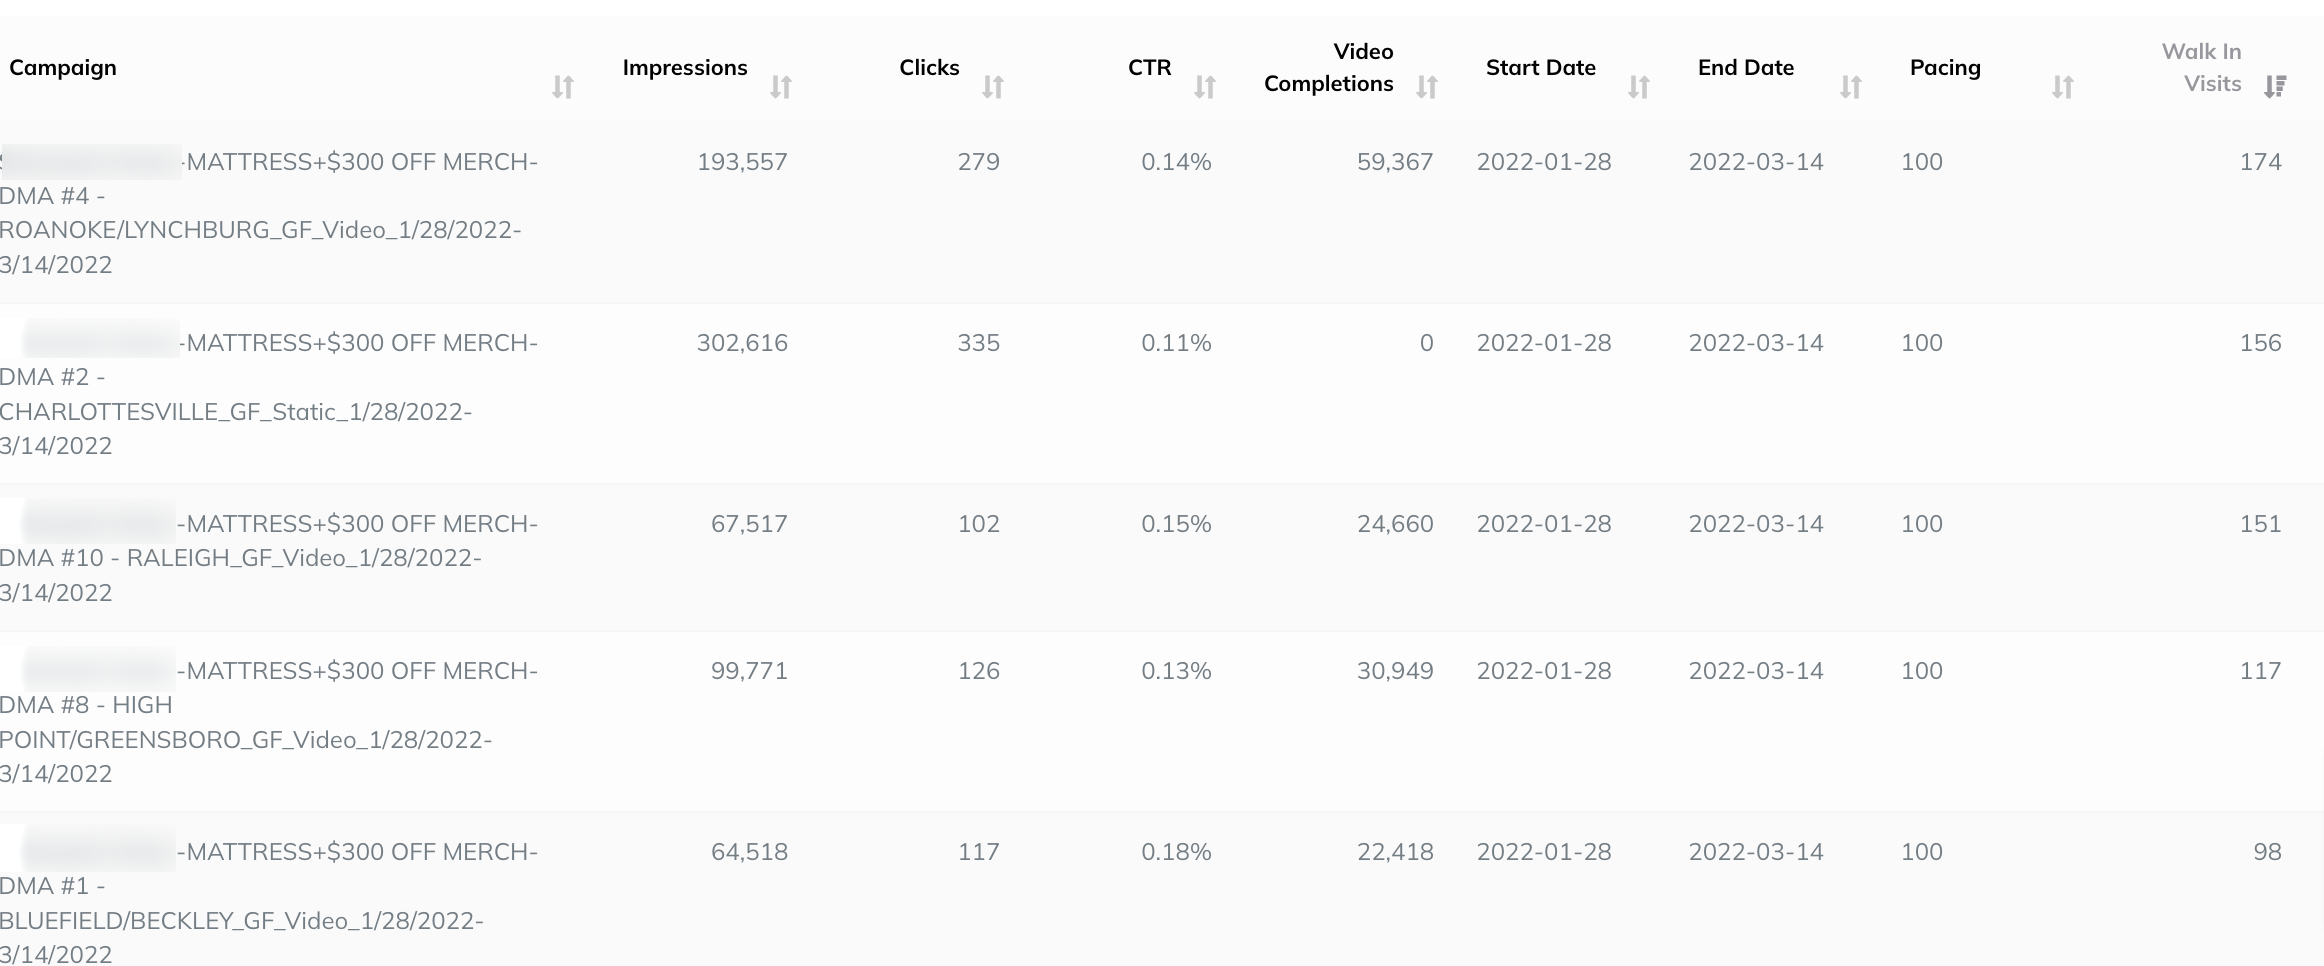
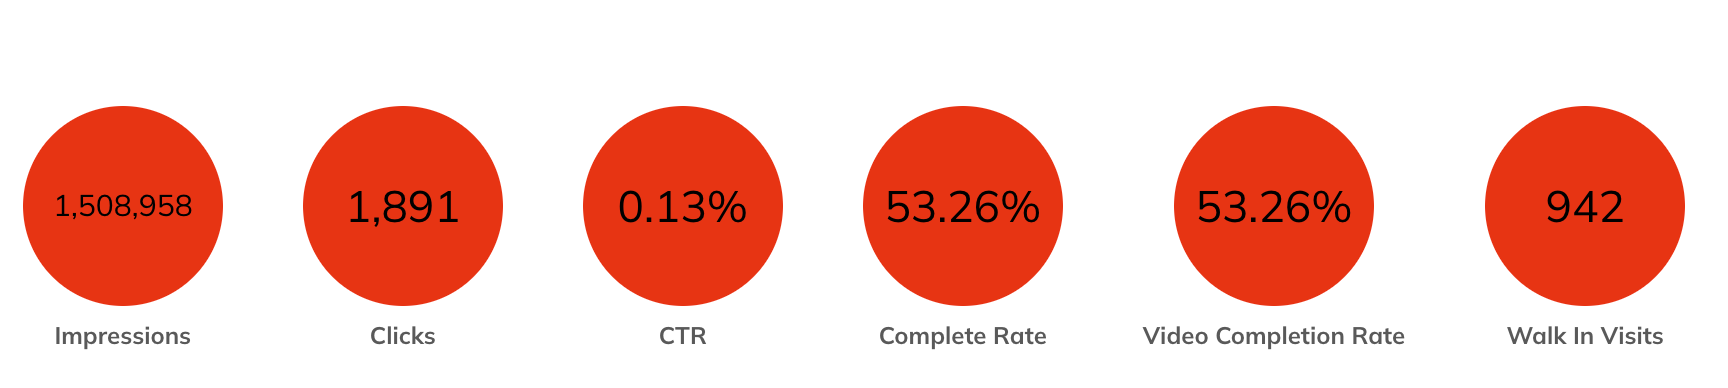 This “holistic” strategy allowed us to drive over 900 walk-ins to their furniture store over a 90-day period. Storage managers were contacting the marketing team about people claiming the coupon codes and noticed the obvious increase in store sales during the advertising period.